Having deployed our applications all over the world on clients server, usually force us to monitor and support those applications.
Few years ago, the normal operation was: log into server clients and discover what is happening based on our application logs.
Yes, watching the logs. The system or application health was controlled with some monitoring system.
But the application logs, always remained at clients servers.
This is a problem, because of time consuming just trying to get remote access to servers.
Why a problem? Because the IT departments of those clients usually sucks.
So the idea now is to externalize all those logs to a central server.
In this way we will be able to detect problems faster and prepare fixes quickly.
This is nothing new, there are a lot of solutions available for this.
In this case we are going to play with logstash and log4j for sending out logs to the “central” server.
Some description before continue:
logstash is a tool for managing events and logs. You can use it to collect logs, parse them, and store them for later use (like, for searching). Speaking of searching, logstash comes with a web interface for searching and drilling into all of your logs. For more info http://logstash.net/
Apache log4j is a logging library for Java. The log4j package is designed so that these statements can remain in shipped code without incurring a heavy performance cost. Logging behavior can be controlled by editing a configuration file, without touching the application binary. For more info http://logging.apache.org/log4j
Now, with that background, lets start.
First, we need to configure logstash to accept all logs coming from our applications or servers (everything using log4j can talk to logstash)
logstash.conf content:
input {
 log4j {
     mode => "server"
     host  => "127.0.0.1"
    port => 56445
    debug => true
    type => "log4j"
 }
}

output {
  stdout { debug => true }
  elasticsearch { embedded => true }
}
We are telling to logstash that there will be and input of type log4j that will listen on port 56445, in this way, the info will be correctly handled. Also, we are telling to start it with elasticseach embedded (a powerful open source search and analytics engine that makes data easy to explore)
We that wonderful configuration is time to run logstath:
java -jar logstash-1.2.2.dev-flatjar.jar agent -f logstash.conf -- web
We are running logstash with the agent mode and web interface using the config file logstash.conf The web interface is available at port 9292.
Time for the java app.
First, the log4j config file, usually log4j.properties
# output messages to stdout and over the network
log4j.rootLogger=ALL,stdout,S

# stdout
log4j.appender.stdout=org.apache.log4j.ConsoleAppender
log4j.appender.stdout.layout=org.apache.log4j.PatternLayout
log4j.appender.stdout.layout.ConversionPattern=%5p %d{HH:mm:ss,SSS} %m%n

# logging over the network. Set port and IP for your network
log4j.appender.S=org.apache.log4j.net.SocketAppender
log4j.appender.S.port=56445
log4j.appender.S.remoteHost=127.0.0.1
Now a very simple sample:
package jtest;

import org.apache.log4j.Logger;

import java.io.IOException;

public class JTest {

    static Logger log = Logger.getLogger(JTest.class.getName());

    public static void main(String[] args) throws IOException, InterruptedException {

        log.debug(String.format("Hello this is an debug message %1$,.2f", Math.random() ));
        log.info(String.format("Hello this is an info message %1$,.2f", Math.random() ));
        log.error(String.format("Hello this is an ERORRRRRRRRRRRRR ERRORRRRR ERRORRRRRR %1$,.2f", Math.random() ));

    }
}
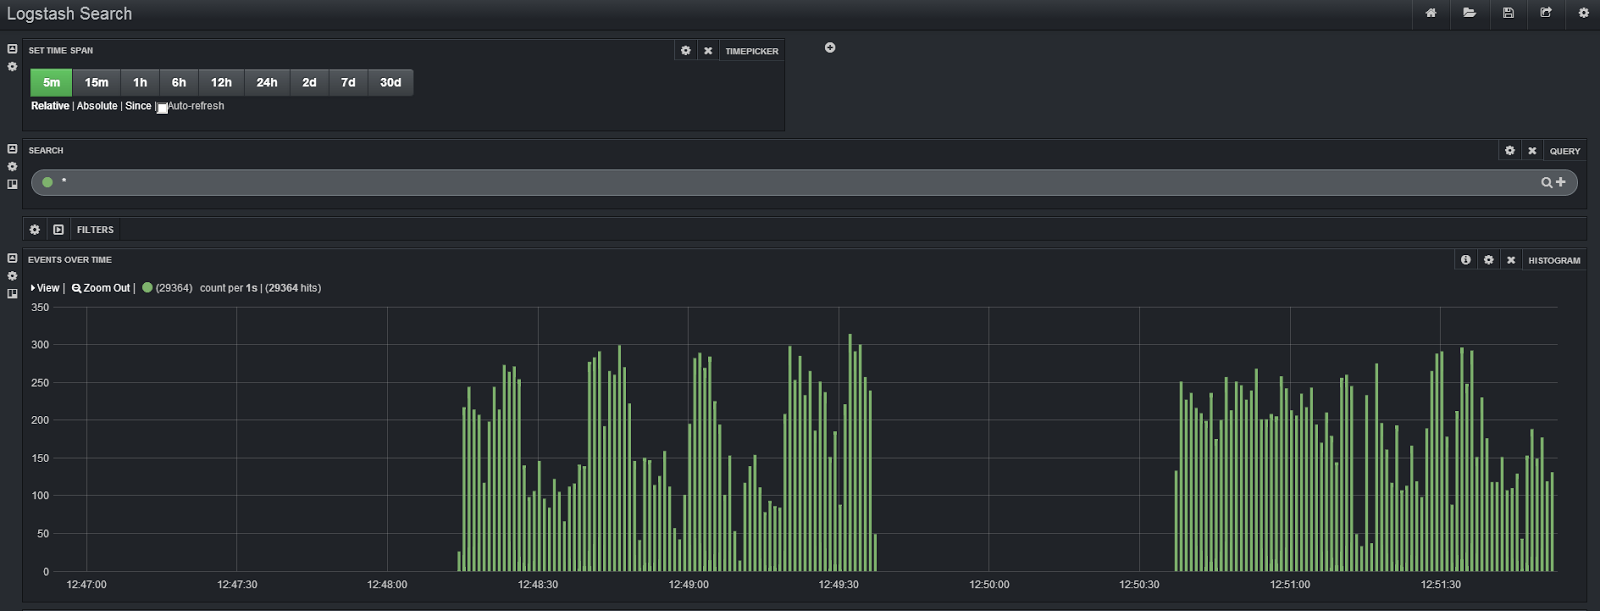
And thats all folks, just hit F5 on the browser (because you are at http://localhost:9292 rigth? ) and that info should appear in logstash.